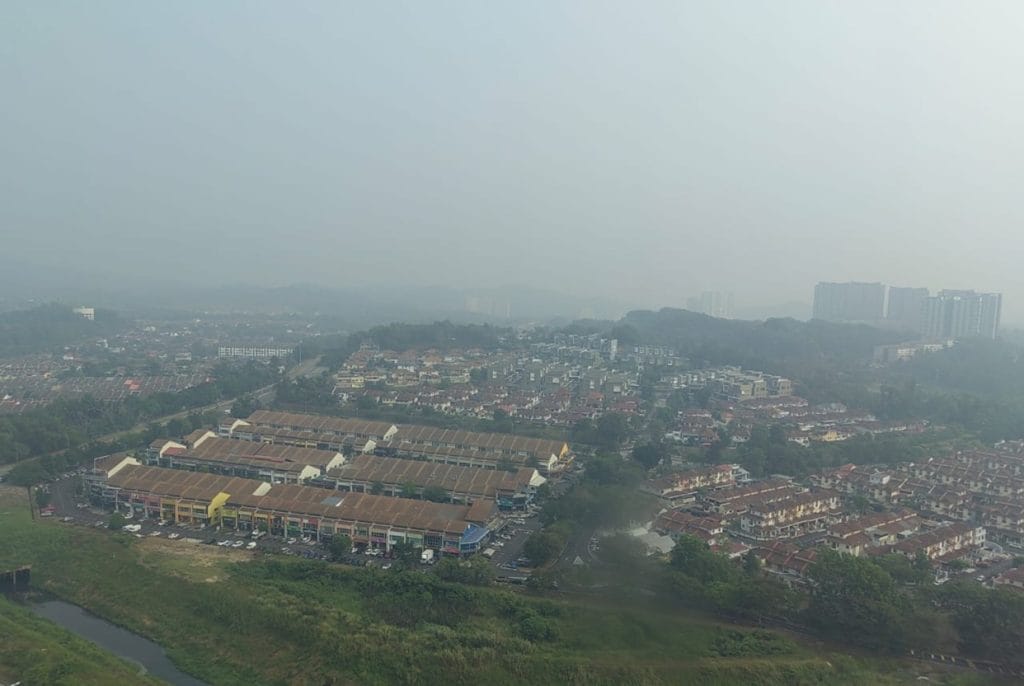
KUALA LUMPUR, Oct 20 – Air quality across Malaysia deteriorated further on Tuesday morning, October 20, 2026, with 30 locations nationwide recording unhealthy Air Pollutant Index (API) levels as of 9 AM.
Data published on the Department of Environment’s (DOE) Air Pollutant Index Management System (APIMS) portal revealed that Batu Muda in Kuala Lumpur and Johan Setia in Selangor recorded the country’s highest API concentrations, both reaching 172.
The Klang Valley and central region remained heavily affected by dense haze cover, with Petaling Jaya and Shah Alam registering 167, Cheras at 165, Klang at 164, Putrajaya at 162, and Banting at 160.
Department officials noted that 31 locations maintained moderate air quality levels, while seven areas retained good API readings nationwide.
State-by-State API Breakdown and Environmental Metrics
Key regional breakdown of locations recording API readings in the unhealthy range (101–200) include:
- Selangor, KL & Putrajaya: Batu Muda (172), Johan Setia (172), Petaling Jaya (167), Shah Alam (167), Cheras (165), Klang (164), Putrajaya (162), and Banting (160).
- Johor: Seven monitoring stations recorded elevated levels, led by Larkin (157), Pasir Gudang (156), Kota Tinggi (153), Kluang (152), Pengerang (151), Batu Pahat (143), and Tangkak (142).
- Negeri Sembilan & Melaka: Nilai recorded the highest reading in Negeri Sembilan at 166, followed by Seremban (160) and Port Dickson (151). In Melaka, Bukit Rambai reached 163, followed by Alor Gajah (155) and Melaka City (153).
- Pahang, Perak & Terengganu: Rompin led Pahang at 152, alongside Balok Baru Kuantan (151), Jerantut (136), Indera Mahkota (115), and Temerloh (104). Perak saw Tasik Ipoh (155) and Pegoh Ipoh (151) hit unhealthy marks, while Paka (156) and Kemaman (101) represented Terengganu.
- Standard API Categories: Under DOE metrics, 0–50 signifies Good, 51–100 Moderate, 101–200 Unhealthy, 201–300 Very Unhealthy, and levels above 300 indicate Hazardous air quality.
Environmental authorities continue to monitor real-time atmospheric data as state education departments enforce outdoor activity suspensions.
–NMT



More Stories
Dewan Rakyat Focuses On Corporate Mafia Allegations, FELDA Governance, And Budget 2027 Debates
MAF And MACC Sign Bilateral Pact To Elevate Governance And Anti-Corruption Enforcement
Schools In Four States Reopen Tuesday With Mandatory Outdoor Activity Suspensions Due To Haze